
📊 Full opportunity report: Battles In The Age Of AI: Visualizing Warzones Live on ThorstenMeyerAI.com — validation score, market gap, and execution plan.

Get business pricing on tech for your team
- Business-only prices and quantity discounts
- Tax-exempt purchasing
- Multiple users, one account, clear invoices
TL;DR
A browser-based visualization transforms live Bitcoin trades into a cinematic battlefield, illustrating market activity as a visceral war scene. The project is accessible, real-time, and purely visual, with no trading functions.
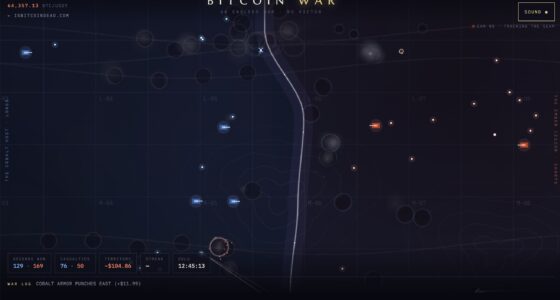
A new web-based visualization transforms real-time BTC/USDT trading data into a dynamic, cinematic battlefield, providing a visceral view of market activity. Developed by isbitcoindead.com and accessible via war.isbitcoindead.com, this tool offers an immersive experience for tech enthusiasts and market observers alike, without involving any trading or financial advice. For more on the ongoing market dynamics, see Bitcoin Battles Unfold in Live Visual War on the Blockchain.
The project uses public WebSocket streams from Binance and Coinbase to capture live trading data, which is then visualized through Bitcoin Battles Unfold in Live Visual War on the Blockchain, HTML Canvas 2D graphics, WebAudio synthesis, and real-time processing entirely client-side. Every trade acts as a combatant—buy orders push the front line from the left, while sell orders counter from the right. Large liquidations are visualized as airstrikes, turning market fluctuations into visceral war scenes.
The system features an automatic camera director that shifts perspectives between broad battlefield views and close-up skirmishes, enhancing the immersive experience. A live DEFCON meter indicates market volatility, while a scrolling log narrates ongoing activity. Additionally, a synthetic soundtrack amplifies the tension, synchronized with market movements. The project’s footprint is minimal—roughly 180KB—demonstrating how advanced web tech can deliver complex visualizations without backend infrastructure.
Importantly, the creators emphasize that Bitcoin War is not a trading tool. It does not involve wallets, signals, or advice, but serves solely as an artistic, data-driven visualization of market chaos, with a footer stating, ‘a live reading of the BTC/USDT tape · no advice, only war.’ For a detailed visualization of Bitcoin market activity, visit Bitcoin Battles Unfold in Live Visual War on the Blockchain.
Implications of Visualizing Market Chaos as War
This project highlights how web technologies can be harnessed for artistic and educational purposes, offering a new lens to understand the volatility and chaos inherent in cryptocurrency markets. It also raises questions about the use of immersive visualizations to interpret financial data, potentially influencing how traders, analysts, and the public perceive market dynamics. While purely artistic, it underscores the raw intensity of market activity, making complex data accessible and visceral.
Bitcoin trading visualization software
As an affiliate, we earn on qualifying purchases.
As an affiliate, we earn on qualifying purchases.
Evolution of Data Visualization in Financial Markets
Traditional financial visualization tools focus on charts, graphs, and dashboards to represent market data. Recently, developers have explored more immersive, artistic representations to depict market activity, especially in volatile assets like Bitcoin. The Bitcoin War project builds on this trend by creating a cinematic battlefield, turning market transactions into a visceral experience. It reflects a broader movement towards visual storytelling in data science, leveraging browser tech to make complex data more engaging and accessible.
“This visualization offers a compelling, visceral view of market activity that could influence how people perceive volatility and chaos in crypto markets.”
— an anonymous researcher
cryptocurrency market data display
As an affiliate, we earn on qualifying purchases.
As an affiliate, we earn on qualifying purchases.
Unconfirmed Aspects of the Visualization’s Impact
It is not yet clear how widely this visualization will influence market perception or trading behavior. Its impact remains primarily artistic and experimental, with no evidence of affecting actual trading strategies or market outcomes. Additionally, the long-term technical stability and potential for further development are still to be observed, as the project is relatively new.
As an affiliate, we earn on qualifying purchases.
Future Developments and Potential Expansions
Developers may expand the visualization’s features, such as integrating more data sources or adding interactive elements. There is also potential for similar visualizations to be applied to other markets or assets, broadening the concept of data-driven, cinematic market representations. Monitoring user feedback and technical updates will be key to understanding its evolving role in data visualization and market education.
As an affiliate, we earn on qualifying purchases.
Key Questions
Is this visualization a trading tool?
No, the project is purely artistic and educational. It does not provide trading signals, advice, or involve any financial transactions.
How does the visualization work technically?
It connects to public WebSocket streams from Binance and Coinbase, then uses browser-based graphics and audio processing to render real-time market activity as a cinematic battle scene.
Can I access this visualization easily?
Yes, it is freely available and runs instantly in any modern web browser by visiting war.isbitcoindead.com.
Will this visualization impact trading or market analysis?
Currently, it is intended as an artistic representation and does not influence trading decisions or market analysis directly.
Source: ThorstenMeyerAI.com
Columbus Day / Indigenous Peoples' Day Picks
long weekend sales
As an affiliate, we earn on qualifying purchases.